
Client Web Application
Blazor WebAssembly application providing the customer-facing interface for report generation, portfolio management, and account administration.
flowchart LR
    U([User - Google Sign-In]):::sec
    AG{AccountGuard}:::sec
    DB[Dashboard]:::app
    SL[Symbol Lists]:::app
    GR[Generate Report]:::app
    MR[My Reports]:::app
    RD[Report Dashboard<br/>3-Level Drill-Down]:::app
    FF[File Browser]:::app
    AI[Ask Claude AI]:::svc
    PY[Billing - Payment]:::svc
    API[(REST API)]:::data
    U --> AG
    AG --> DB
    DB --> SL
    SL --> GR
    GR --> API
    API --> MR
    MR --> RD
    RD --> AI
    FF --> AI
    DB --> PY
    RD --> FF
    classDef app fill:#1f2630,stroke:#C0894E,color:#F3EFE8;
    classDef svc fill:#241c14,stroke:#E2B583,color:#F3EFE8;
    classDef data fill:#22201a,stroke:#C0894E,color:#EBD3AE;
    classDef ext fill:#1b1f27,stroke:#5A616B,color:#C4C0B8;
classDef sec fill:#1d2733,stroke:#5cc8e0,color:#eafaff;Gmi.ClientWeb.Blazor
The client-facing web application built with Blazor WebAssembly provides customers with a complete self-service platform across 93 pages -- 56 private authenticated pages, 35 public marketing and content pages, and 2 authentication/utility pages:
Private Pages
- Personalized dashboard with the guided first report card for new accounts
- Getting started guide with video walkthrough (optional reference, no longer forced)
- Watchlist Dashboard and Stock Screener
- Recurring Reports with automatic Claude change analysis
- Earnings Setup drill-down from the Earnings Lab, with the run-up chart and GMI's Read
- Investor Legends and Smart Lists, plus "Save as Smart List" on the screener
- Alerts: home, "charges apply" consent, event picker and delivery history
- Compare to Benchmark on position reports
- Symbol list template marketplace
- Symbol list management (add/edit)
- Position report tracking (list & detail view)
- Report generation with scheduling
- Report history & downloads
- Interactive report dashboard with Syncfusion charts, price visualization, ML projections, and instant loading
- File browser with folder navigation
- Email notification management
- SMS notification management
- Account settings
- Payment method management (add/manage)
- Billing & usage dashboard
- Account creation & pending approval flow
- Payment setup & email validation
- Macro Dashboard — regime, Macro Grade, playbook, sector grades
- Macro ML Forecasts — 1/2/6-month projections with tailwind/headwind readings
- Commodities & Hard Assets — with bullish/bearish signal readings
- Commodities ML Forecasts — projections for five hard assets
- Macro Lab, Macro Calendar, and the four-level data drill-down
- My Shared Reports — share-link management
Public Pages
- Landing page (Index): "For investors who read the numbers, not the headlines."
- Walkthrough: four beats over a real, dated Apple grade, ending in "pick a company you know"
- How It Works
- Why Grade My Investments
- Supported Investment Strategies
- Sample Reports with downloads
- Pricing
- Blog (investor insights)
- FAQ
- Our History
- Free Report Offer
- How We Integrated Claude AI
- 50 Questions Claude Can Answer
- Using AI to Analyze Report Files
- Privacy Policy
- Terms & Conditions
Shared Components & Infrastructure
The application uses 11 shared components and 5 JavaScript interop modules that provide cross-cutting functionality across all private pages:
Shared Blazor Components
- BackgroundJobMonitor -- polls every 15 seconds to detect completed report generations, downloads, Claude AI analyses, and report comparisons, then triggers in-app notifications
- NotificationBar -- animated slide-down notification banners with color-coded severity (success, info, warning, error), action links, and dismiss buttons
- TickerTape -- fixed-position scrolling ticker at the bottom of the screen displaying all unique symbols from the user's symbol lists with play/pause control
- GuidedTourProvider -- Shepherd.js-powered onboarding tour that walks new users through the dashboard; marks completion via API so it only runs once
- IdleTimeoutProvider -- configurable session idle timeout with a modal warning before automatic logout
Shared Blazor Components (cont.)
- AccountGuard -- route-level guard that intercepts navigation and redirects users to account creation, pending approval, or payment setup pages as needed
- CreditCardExpirationBanner -- proactive warning banner when the default payment card is expiring soon; auto-redirects to payment page if all cards are expired
- CookieNotice -- GDPR-style cookie/local storage notice with localStorage-based dismissal persistence
- PageHelpButton -- per-page contextual help modal accessible via a floating question-mark button on each page
- AnnouncementBanner -- polls for active platform announcements and displays dismissible notification banners to all users
- MaintenanceBanner -- polls for upcoming/active maintenance windows and displays warning banners with scheduled downtime details
JavaScript Interop Modules
- guided-tour.js -- Shepherd.js tour orchestration with .NET callback on completion
- idle-timeout.js -- Activity tracking (mouse, keyboard, scroll, touch) with configurable warning and timeout timers
- stripe-interop.js -- Stripe Elements integration for PCI-compliant card number, expiry, and CVC collection
- file-download.js -- Base64-to-blob file download utility for report ZIP packages
- timezone-interop.js -- Browser timezone detection via Intl API for localized timestamp display
Layout Architecture
The application uses a dual-layout architecture with 3 layout components to serve both public visitors and authenticated users:
- AuthorizeView gating
- Top navbar with user dropdown
- Sidebar navigation (NavMenu)
- CreditCardExpirationBanner
- NotificationBar
- BackgroundJobMonitor
- AccountGuard wrapper
- IdleTimeoutProvider
- TickerTape footer
- CookieNotice
- Public navbar with full nav
- How It Works, Pricing, Blog, FAQ, Sample Reports, Strategies, History, Free Report links
- Google sign-in button
- Footer with platform, support, and legal links
- CookieNotice
- 13 sidebar navigation links
- Dashboard
- Getting Started
- Symbol List Templates
- Symbol Lists
- Position Reports
- Generate Report
- My Reports
- Browse My Report Files
- Email & SMS Notifications
- Account, Payment, Billing
Application Screenshots
Screenshots showcasing the key pages and functionality of the Grade My Investments Client Web Application:
Dashboard
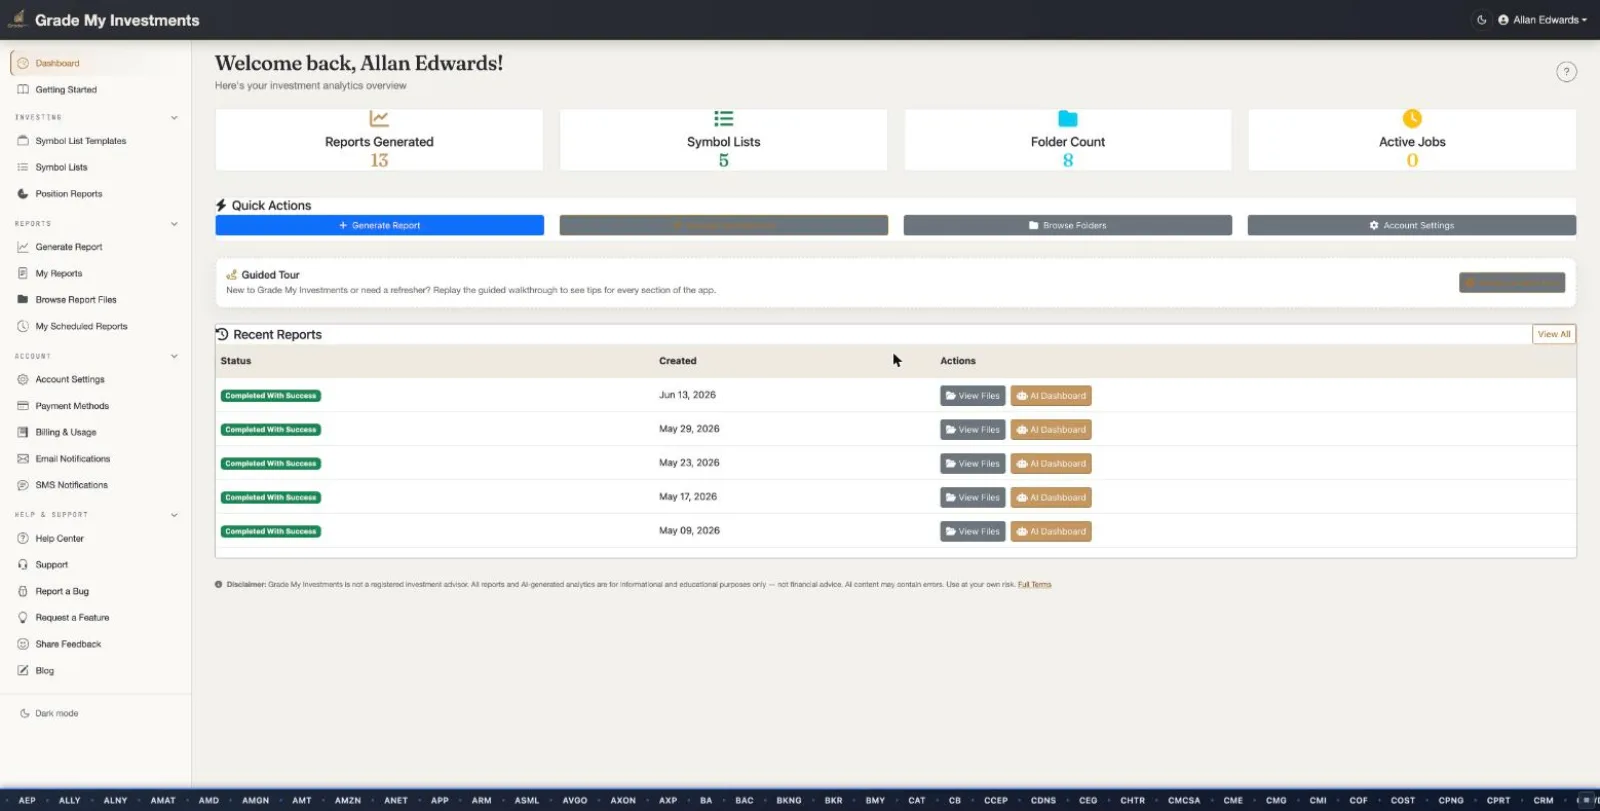
Personalized Dashboard
The main dashboard welcomes users with a personalized overview:
- Key Metrics: Reports generated, symbol lists, folder count, and active jobs at a glance
- Quick Actions: Color-coded buttons to generate reports, manage symbol lists, browse folders, and access account settings
- Guided Tips: Contextual tips for new users to get up and running quickly with links to key areas of the app
- Recent Reports: Latest report generation jobs with status, creation time, and quick action buttons
- Guided Tour: Shepherd.js-powered interactive onboarding tour that auto-launches for new users and walks them through every section of the dashboard
- Page Help: Contextual help button providing detailed guidance for the dashboard
Getting Started Guide
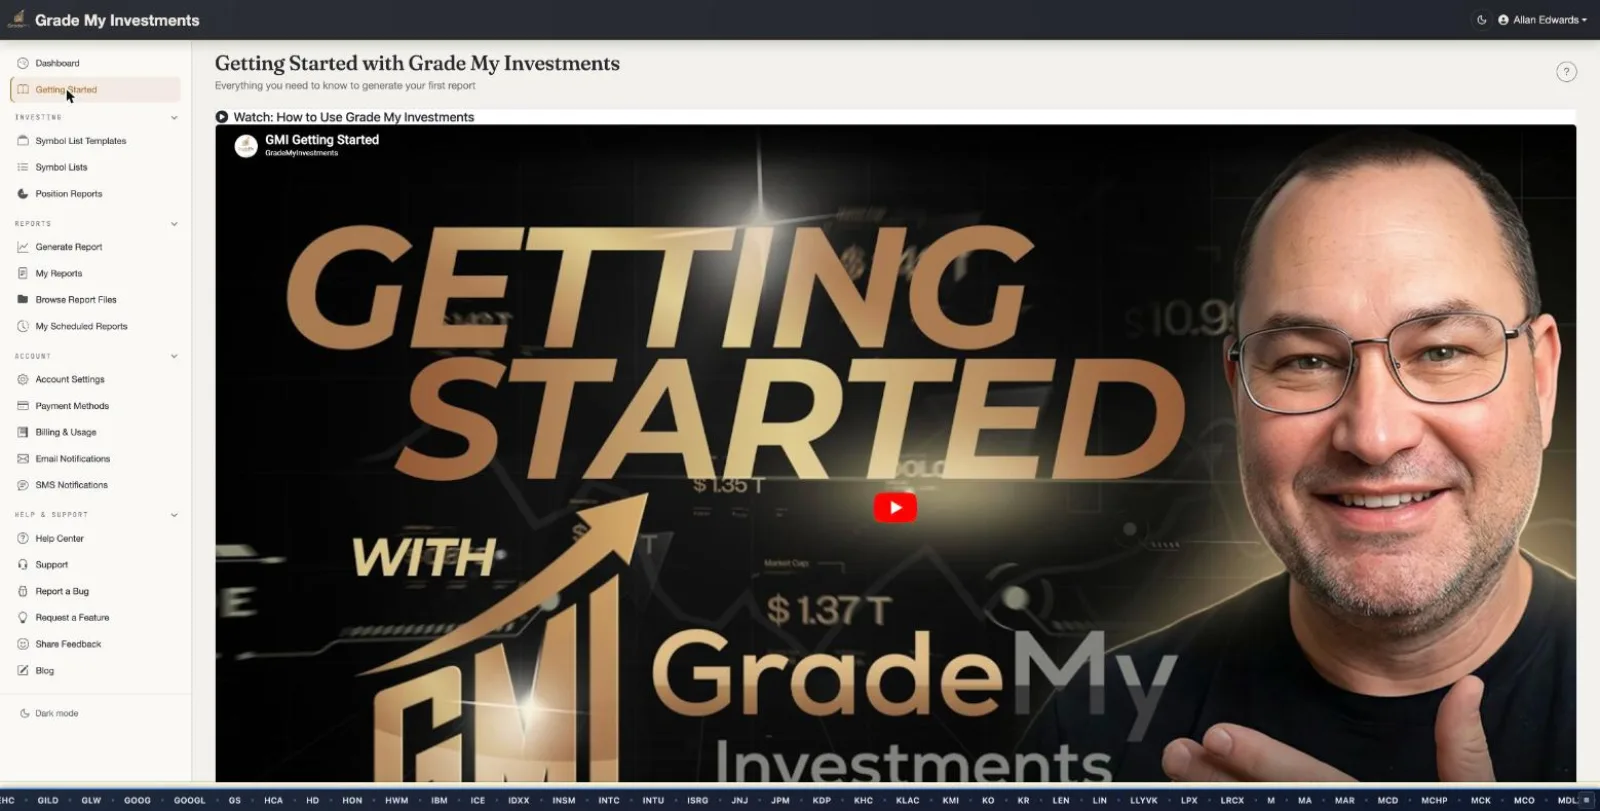
Comprehensive Getting Started Guide
Reference material with a video walkthrough and pricing transparency. Since September 2026 it is one click away in the nav rather than forced on first visit; new accounts start with the guided first report instead:
- Video Walkthrough: Embedded getting started video showing how to use Grade My Investments
- How Reports Work: Visual step-by-step explanation of the report generation workflow
- Transparent Pricing: Clear breakdown of costs -- report generation ($0.30/symbol), Claude AI analysis, and file storage ($2.00/month)
- How Billing Works: Explanation of the billing cycle, invoicing, and payment processing
- Feature Overview: Sections covering reports, Claude analysis, position reports, notifications, and more
- Quick Links: Direct links to key areas of the application for fast navigation
Symbol List Templates
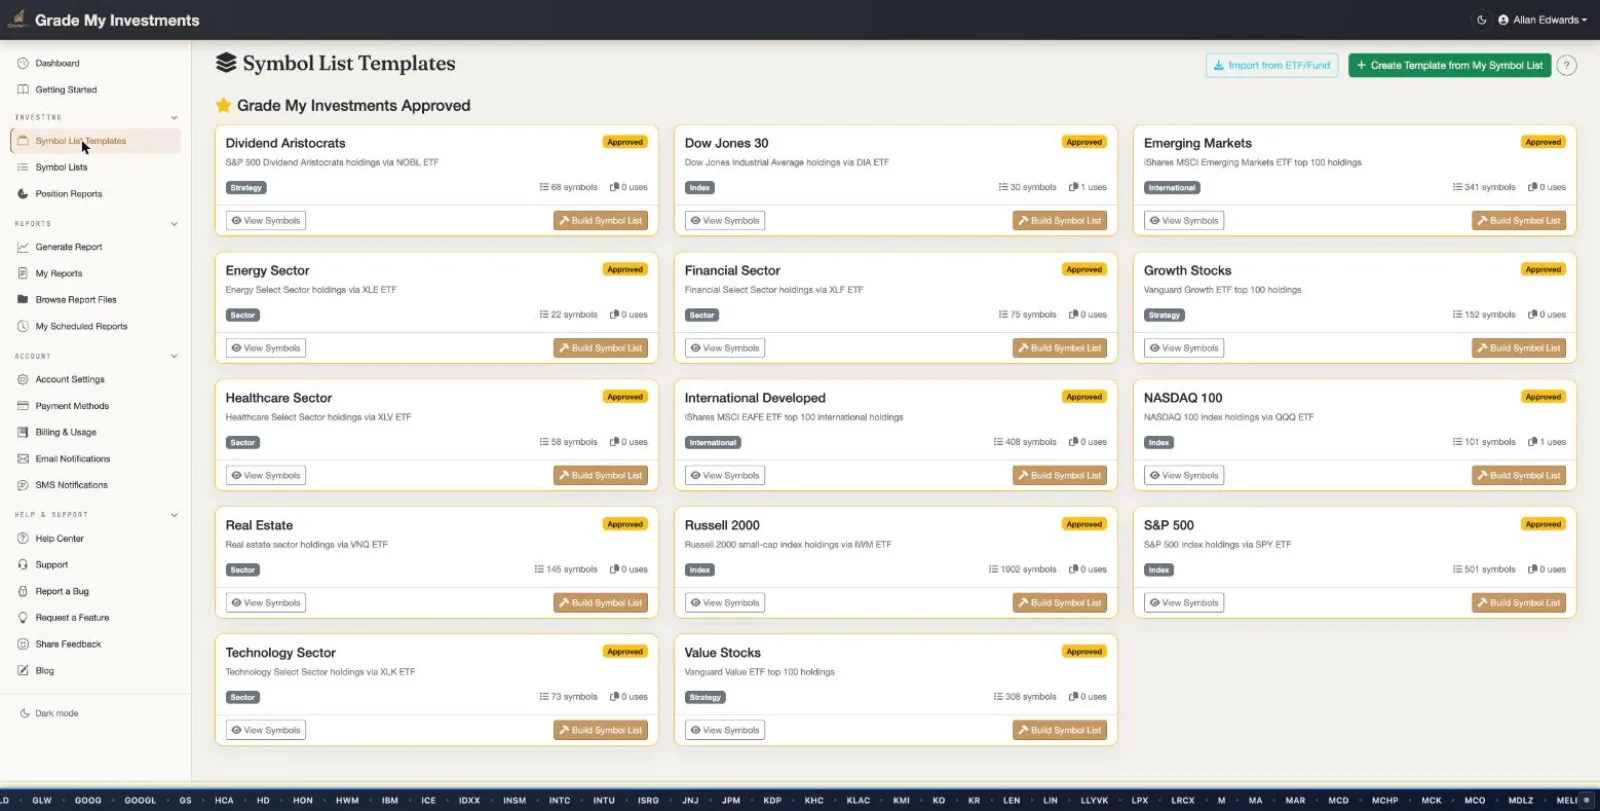
Symbol List Template Marketplace
Browse and use pre-built symbol list templates with ETF-sourced data:
- Grade My Investments Approved: Curated templates sourced from major ETFs -- Dividend Aristocrats, Dow Jones 30, S&P 500, NASDAQ 100, sector ETFs (Energy, Financial, Healthcare, Technology), and more
- Template Details: Each template shows symbol count, usage stats, and ETF source badge
- Import from FMP: Import new templates directly from Financial Modeling Prep ETF data
- Community Templates: Searchable community-contributed templates with category filtering and popularity sorting
- One-Click Use: View symbols and create a symbol list from any template instantly
- Pagination: Paginated browsing for large template collections
Symbol Lists
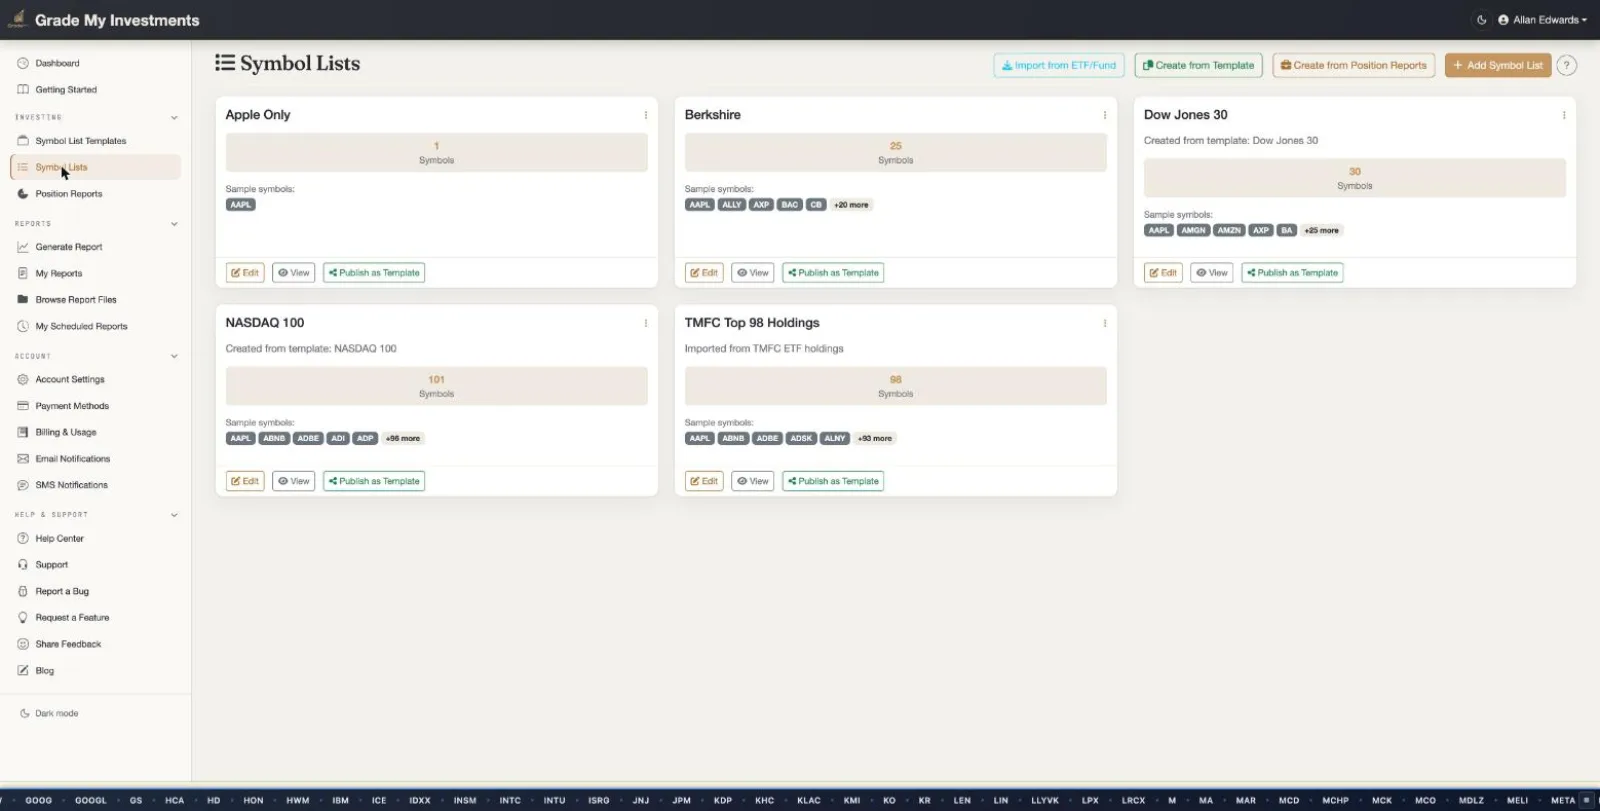
Symbol List Management
Create and manage custom symbol lists for analysis:
- Multiple Lists: Maintain multiple symbol lists for different portfolios or analysis needs
- Symbol Badges: Visual symbol ticker badges showing all holdings in each list at a glance
- Template Import: Create lists from approved templates or build them manually with FMP symbol validation
- Publish as Template: Share your symbol lists as community templates for other users
Position Reports
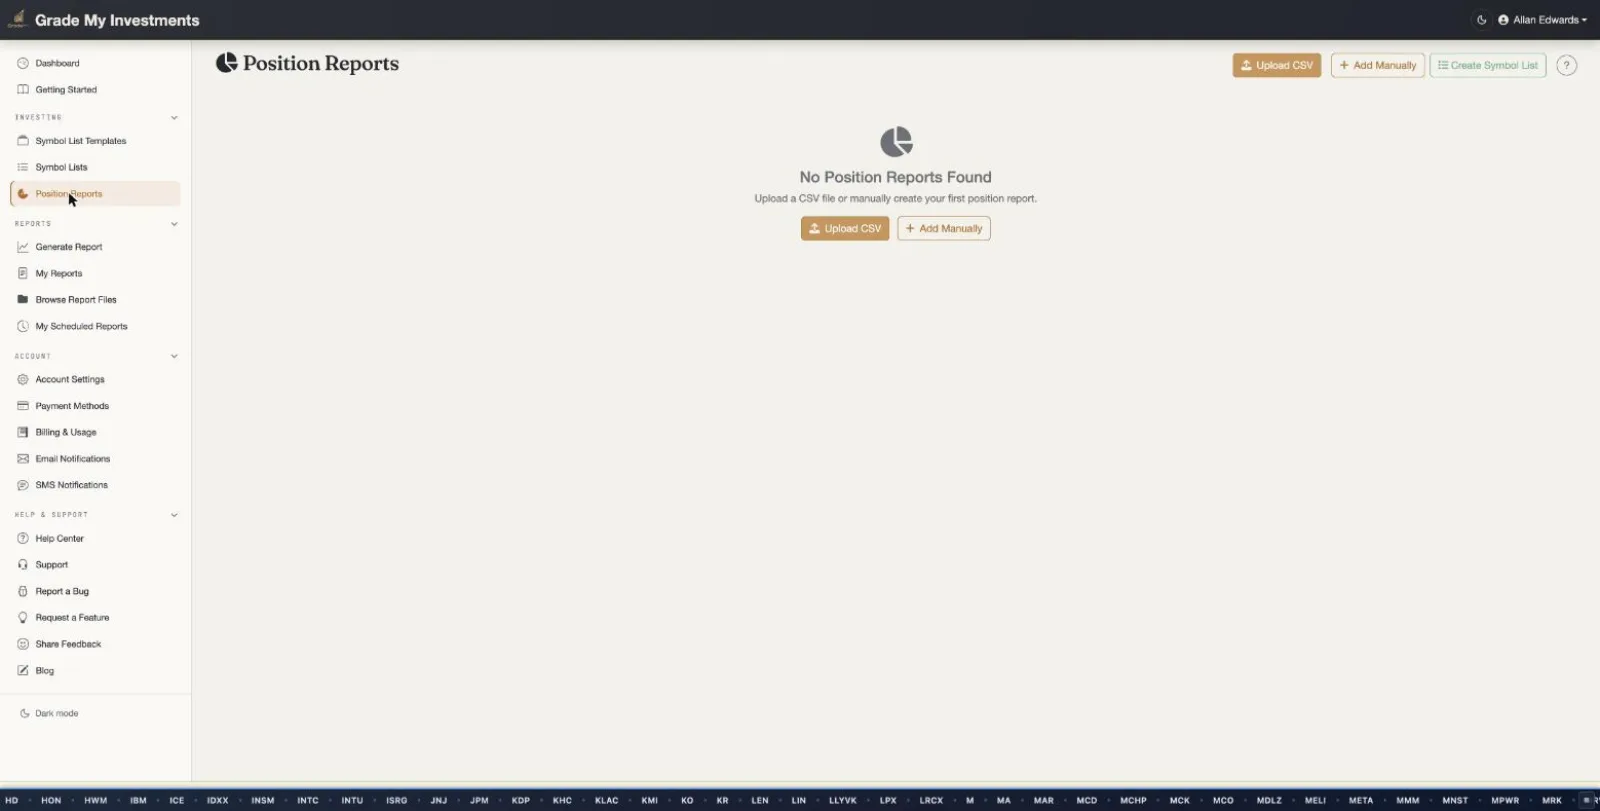
Portfolio Position Tracking
Track portfolio positions for projected analysis reports:
- Position Entry: Enter stock positions with symbol, number of shares, and cost basis with FMP symbol validation
- Multiple Portfolios: Create and manage multiple position reports
- Detail View: Dedicated detail page per position report showing summary cards (positions count, total cost basis, total shares, created date)
- Projected Analysis: Position data feeds into projected analysis report generation
- Page Help: Contextual help button explaining position management
Generate Report
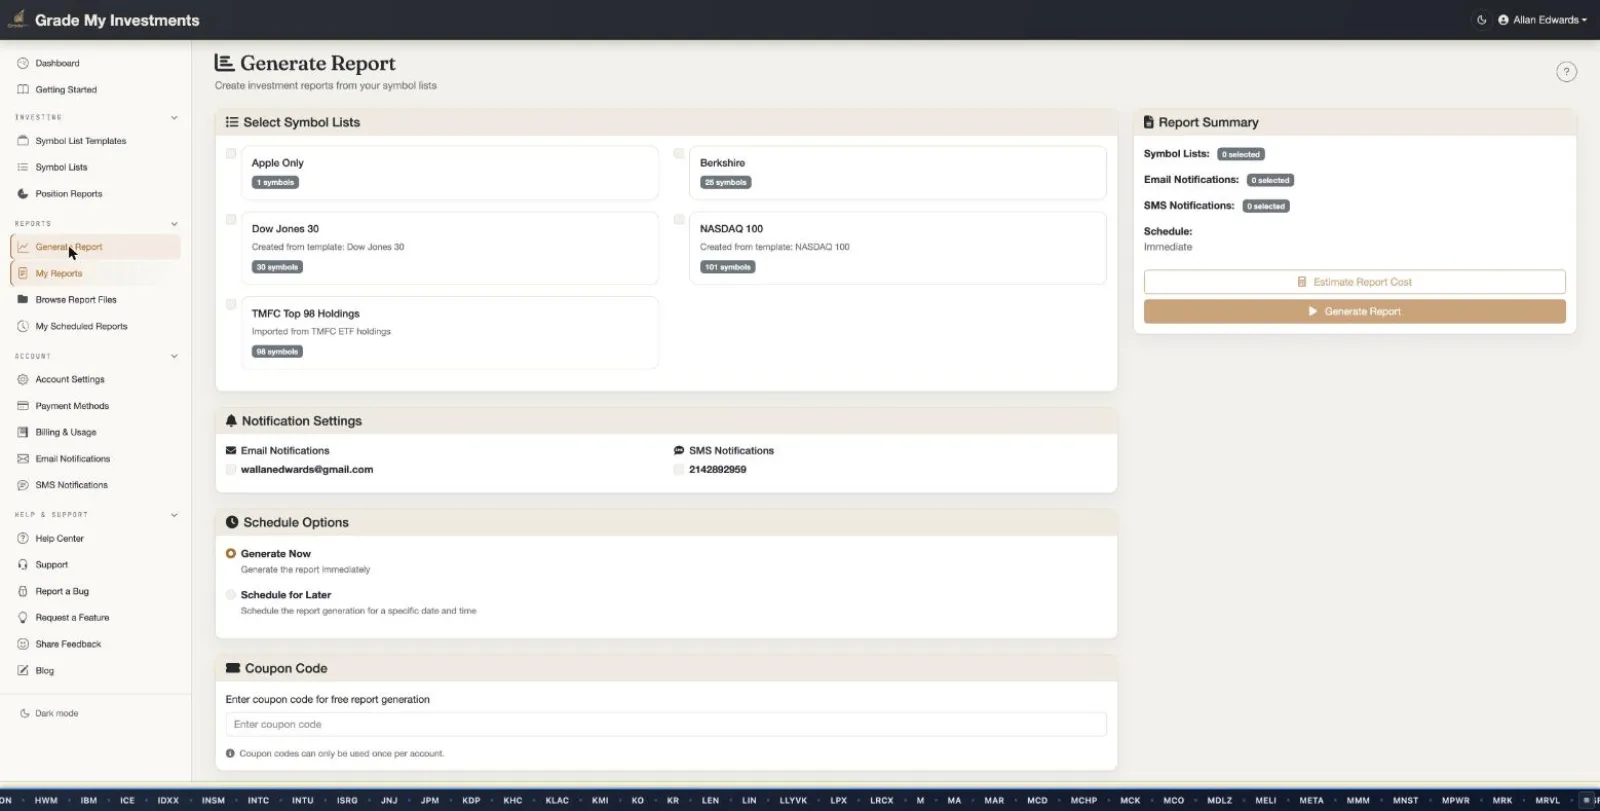
Report Generation Interface
Generate financial analysis reports with full control over options:
- Symbol List Selection: Choose one or more symbol lists to analyze with checkbox selection
- Notification Settings: Configure email and SMS notifications for job completion with pre-populated addresses and numbers
- Schedule Options: Generate immediately or schedule for a specific date and time
- Coupon Codes: Apply promotional coupon codes for discounted report generation
- Report Summary: Live sidebar showing selected lists, notification recipients, and estimated cost before submission
Report Generations
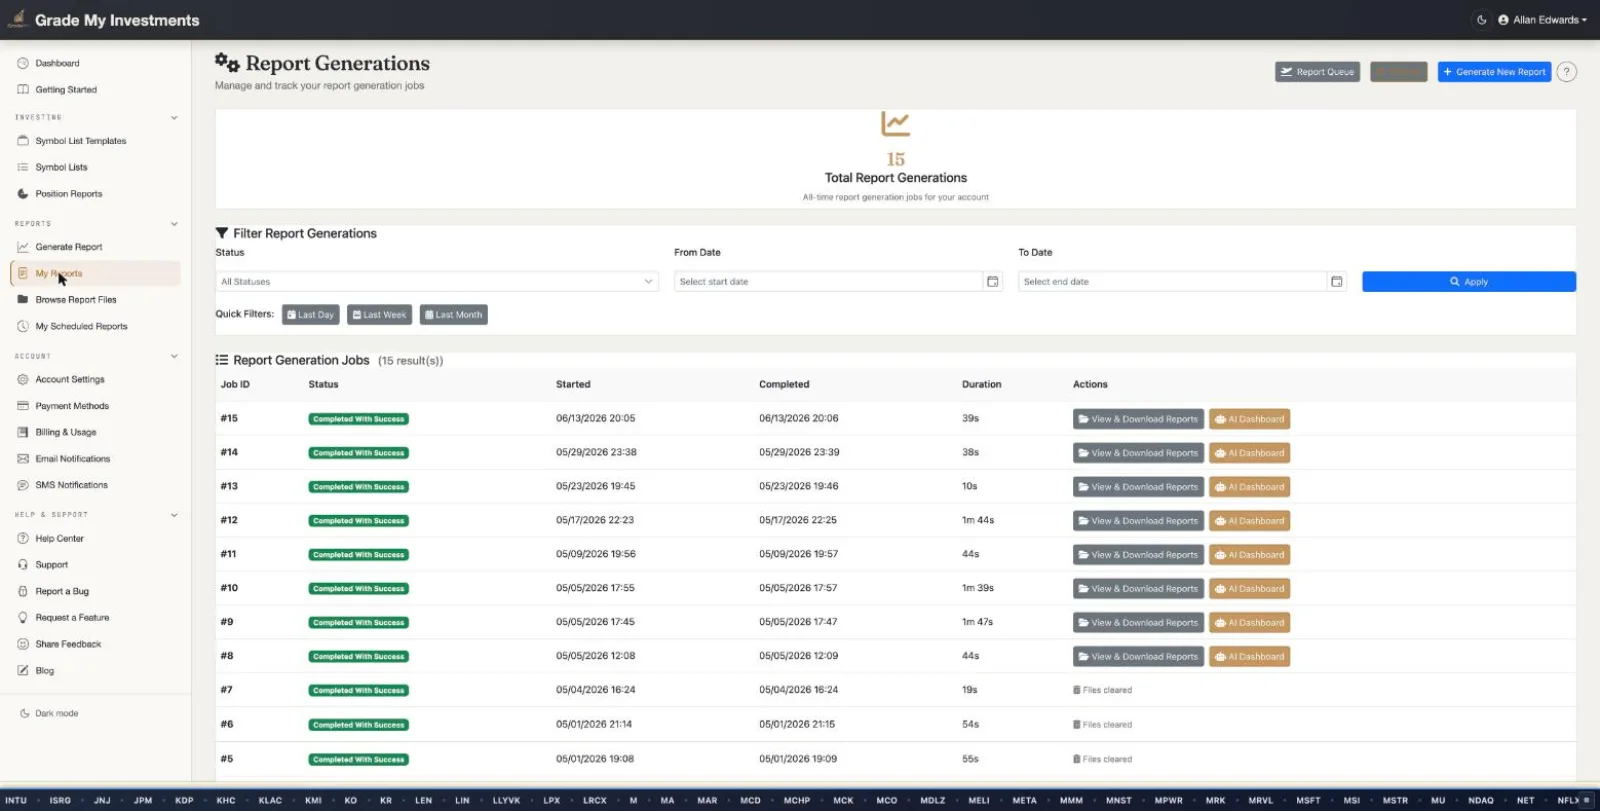
Report Generation History
View and manage all your report generation jobs:
- Total Report Count: Summary count of all report generations with visual indicator
- Advanced Filtering: Filter by date range with quick filter buttons (Last Day, Last Week, Last Month)
- Job Details: Table showing Job ID, status (color-coded badges), started/completed timestamps, and duration
- Quick Actions: View and download reports or compare report outputs directly from the list
Interactive Report Dashboard
Financial Deep-Dive Dashboard
An interactive, multi-level drill-down dashboard for exploring report data with Syncfusion charts:
- Instant Loading: Pre-computed dashboard summaries generated at report time for instant load regardless of portfolio size (supports 2000+ symbols)
- Level 1 -- Portfolio Overview: Aggregate KPIs, sector breakdown, AI grade distribution, ML health score distribution chart, and portfolio-level revenue and cash flow forward projections with confidence intervals
- Level 2 -- Symbol Detail: Interactive price chart with volume bars, ML sentiment forecast visualization, company profile, and financial drill-down cards
- Level 3 -- Financial Deep Dive: Full financial statement exploration with tabs for Income Statement, Balance Sheet, Cash Flow, Key Metrics, Analyst Data, and ML Forecasts
- Yearly/Quarterly Toggle: Switch between annual and quarterly views for all financial statements
- Breadcrumb Navigation: Multi-level breadcrumb trail for navigating between overview, symbol, and financial detail levels
- Ask Claude AI: Context-aware AI Q&A at every dashboard level -- ask questions about your portfolio, individual symbols, or financial statements
Browse My Report Files
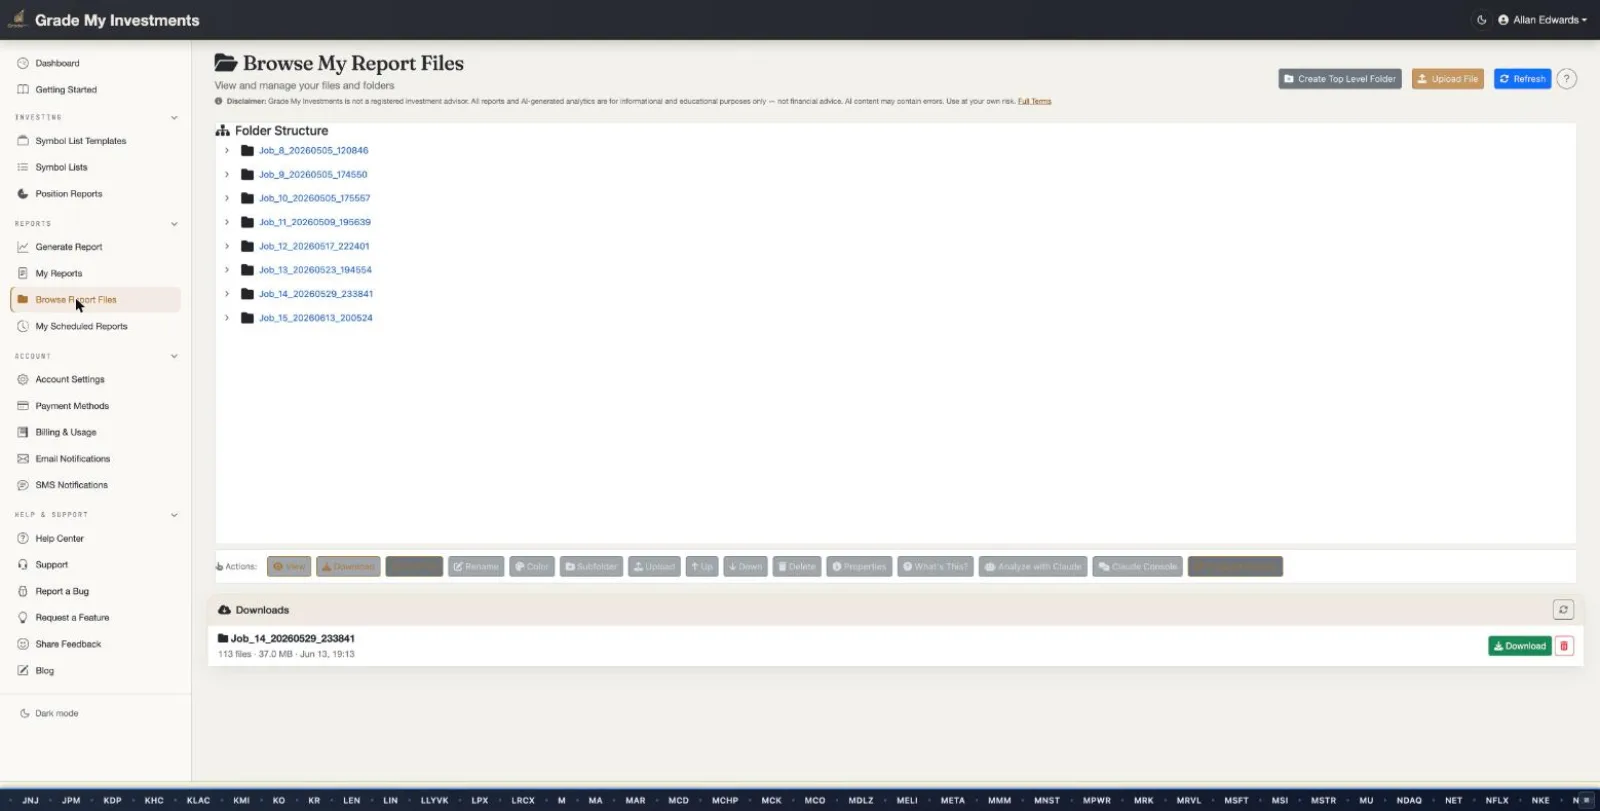
File Browser
Browse and download report files organized in a hierarchical folder structure:
- Folder Tree: Expandable folder hierarchy showing report job folders with nested subfolders for reports, raw data, and analysis files
- File Toolbar: Action buttons for common operations including rename, move, delete, analyze with Claude AI, and more
- Downloads: Dedicated download section for retrieving generated ZIP packages of report files
- Claude Analysis Jobs: View and manage AI analysis jobs run on report files with status tracking
- Report Comparison: Compare report outputs across different generations to track changes over time
Email Notification Addresses
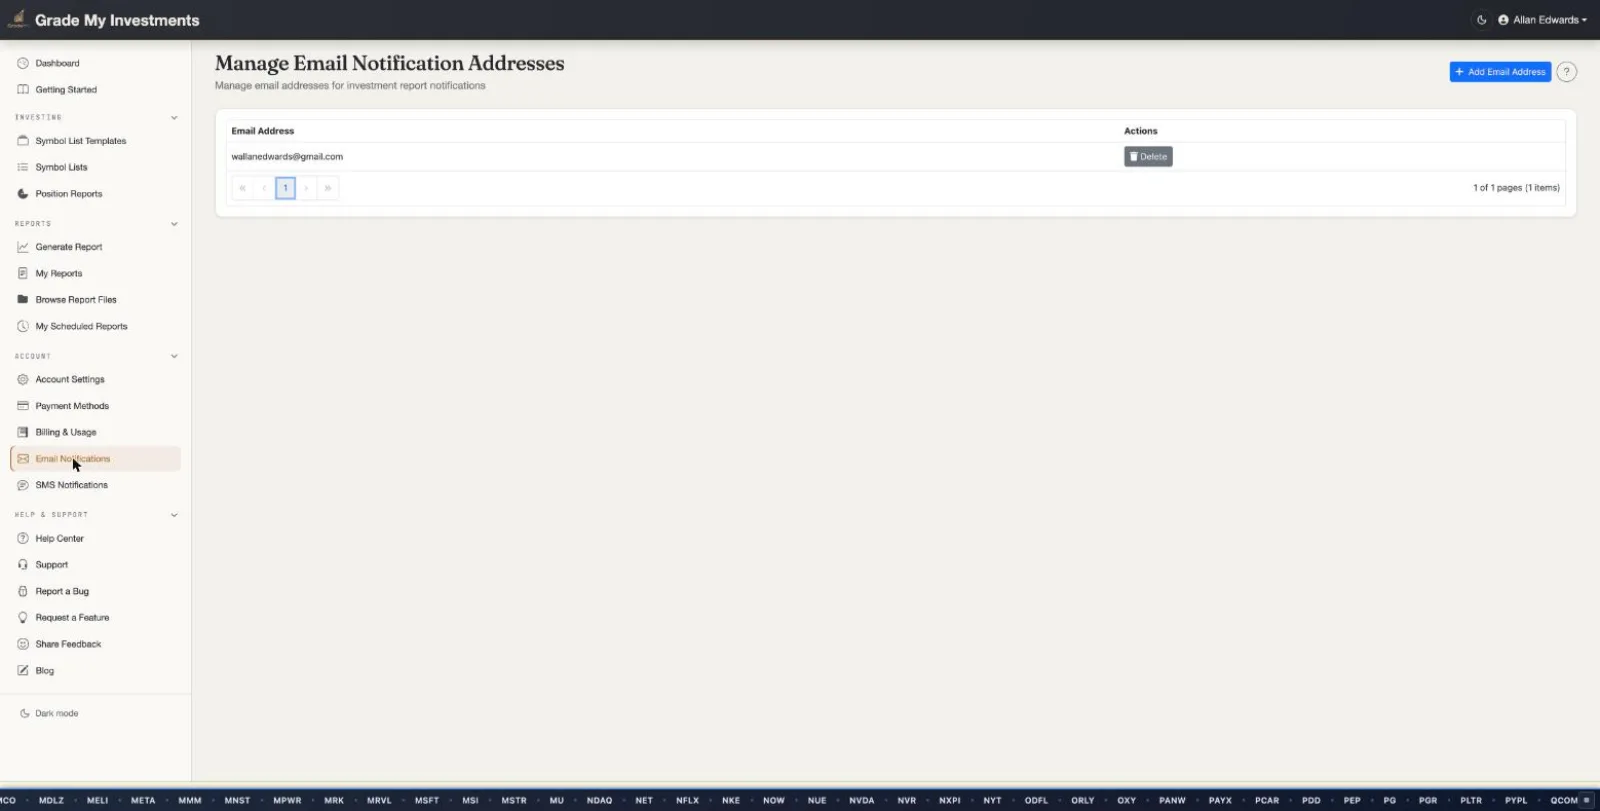
Email Notification Management
Manage email addresses for report completion notifications:
- Address Management: Add and manage email addresses for notifications via a dedicated add page
- Email Verification: Verify email addresses before receiving notifications
- Notification Preferences: Choose which events trigger email alerts
SMS Notification Numbers
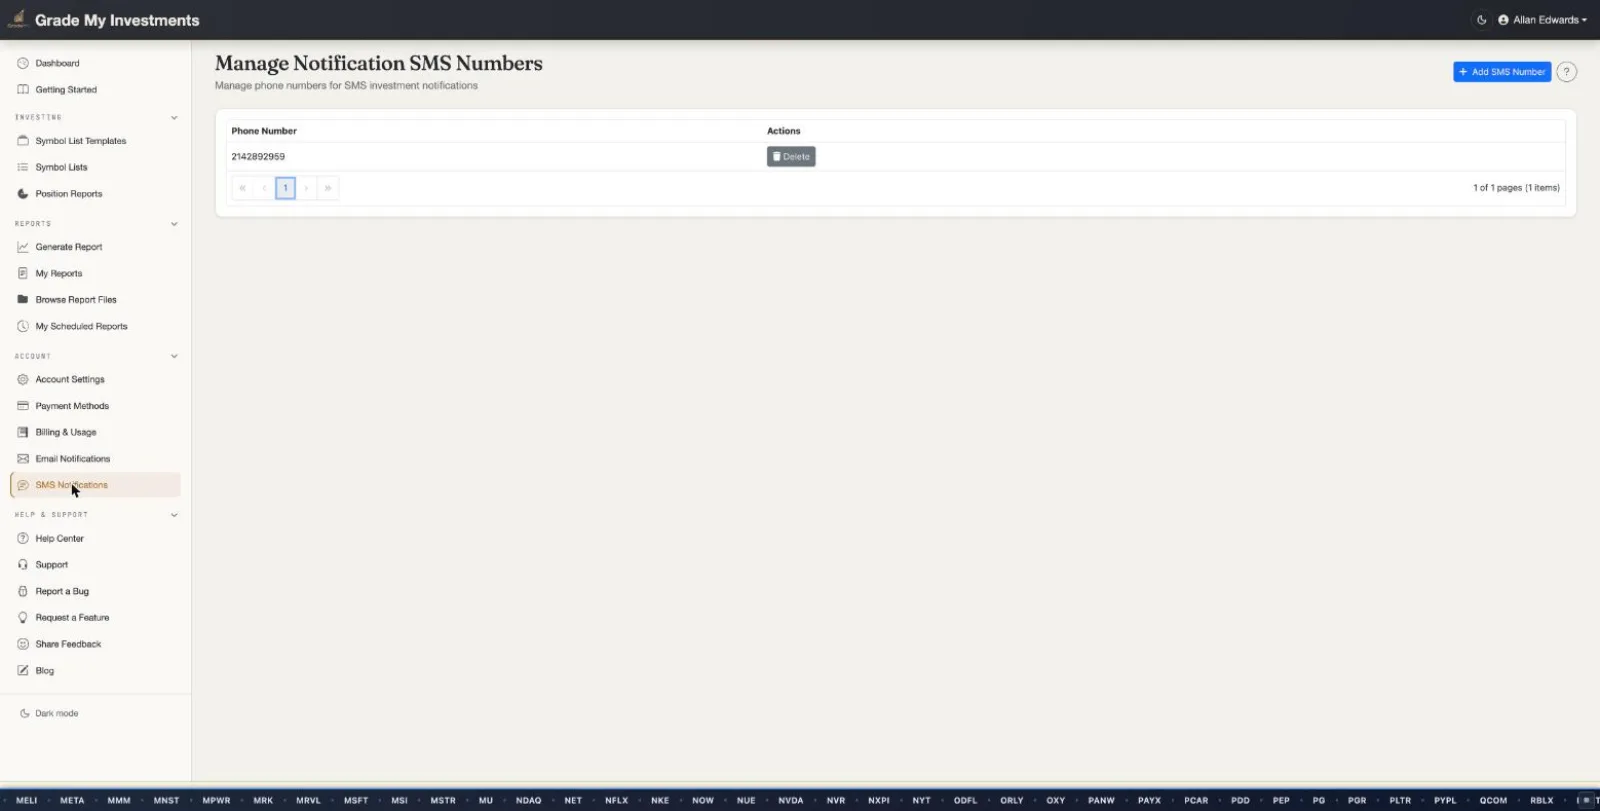
SMS Notification Management
Manage SMS phone numbers for report completion notifications:
- Phone Numbers: Add and manage mobile numbers for SMS alerts via a dedicated add page
- Verification: Verify phone numbers via Twilio before receiving notifications
- Alert Configuration: Choose which events trigger SMS notifications
Account Settings
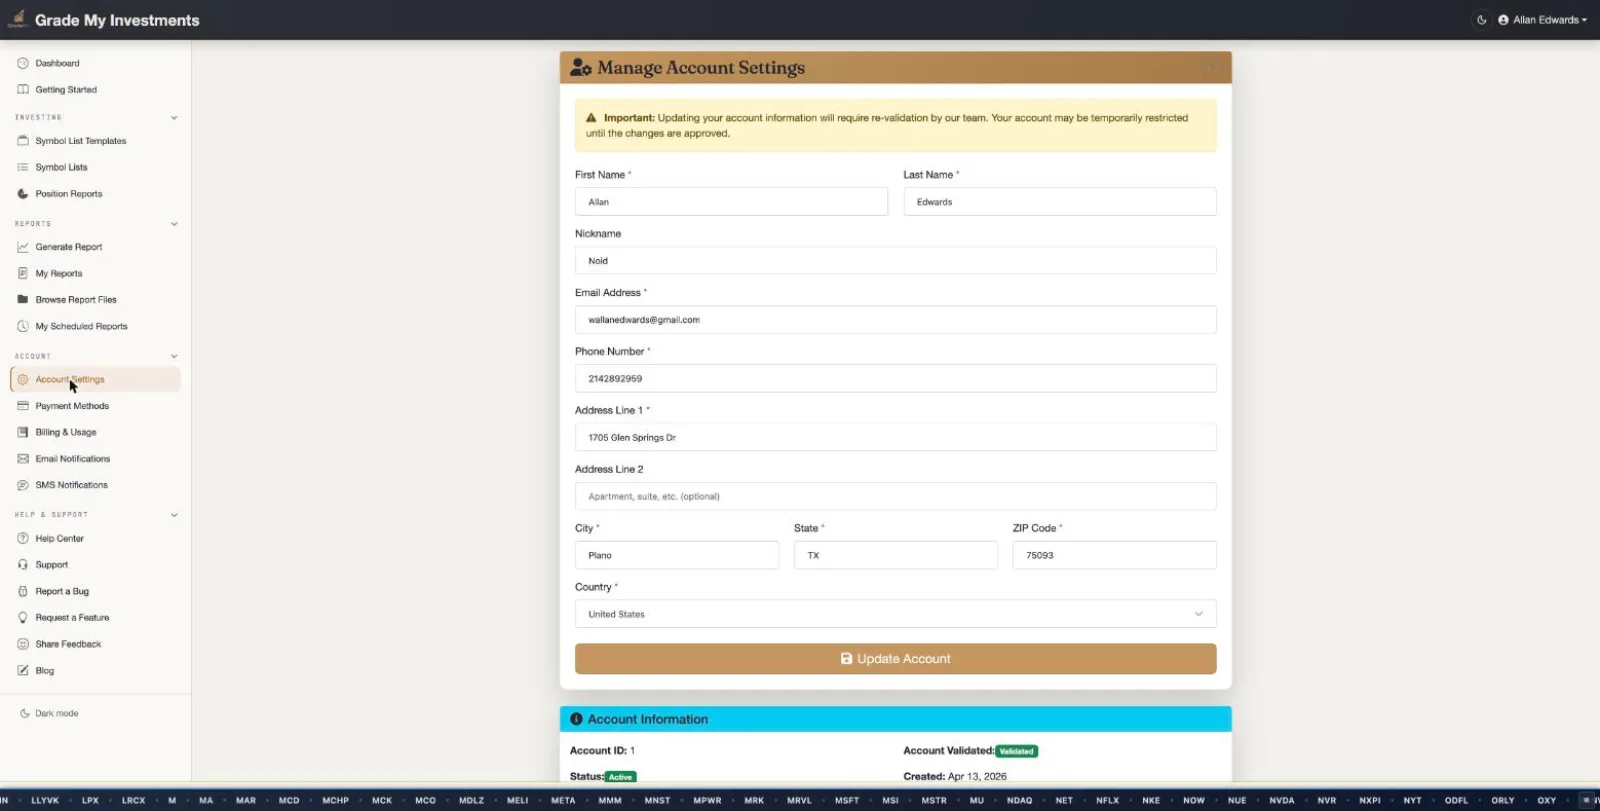
Account Settings
Manage your account profile and preferences:
- Profile Management: Update personal information and display name
- Contact Information: Manage email and phone number settings
- Preferences: Configure application behavior and defaults
Payment Methods
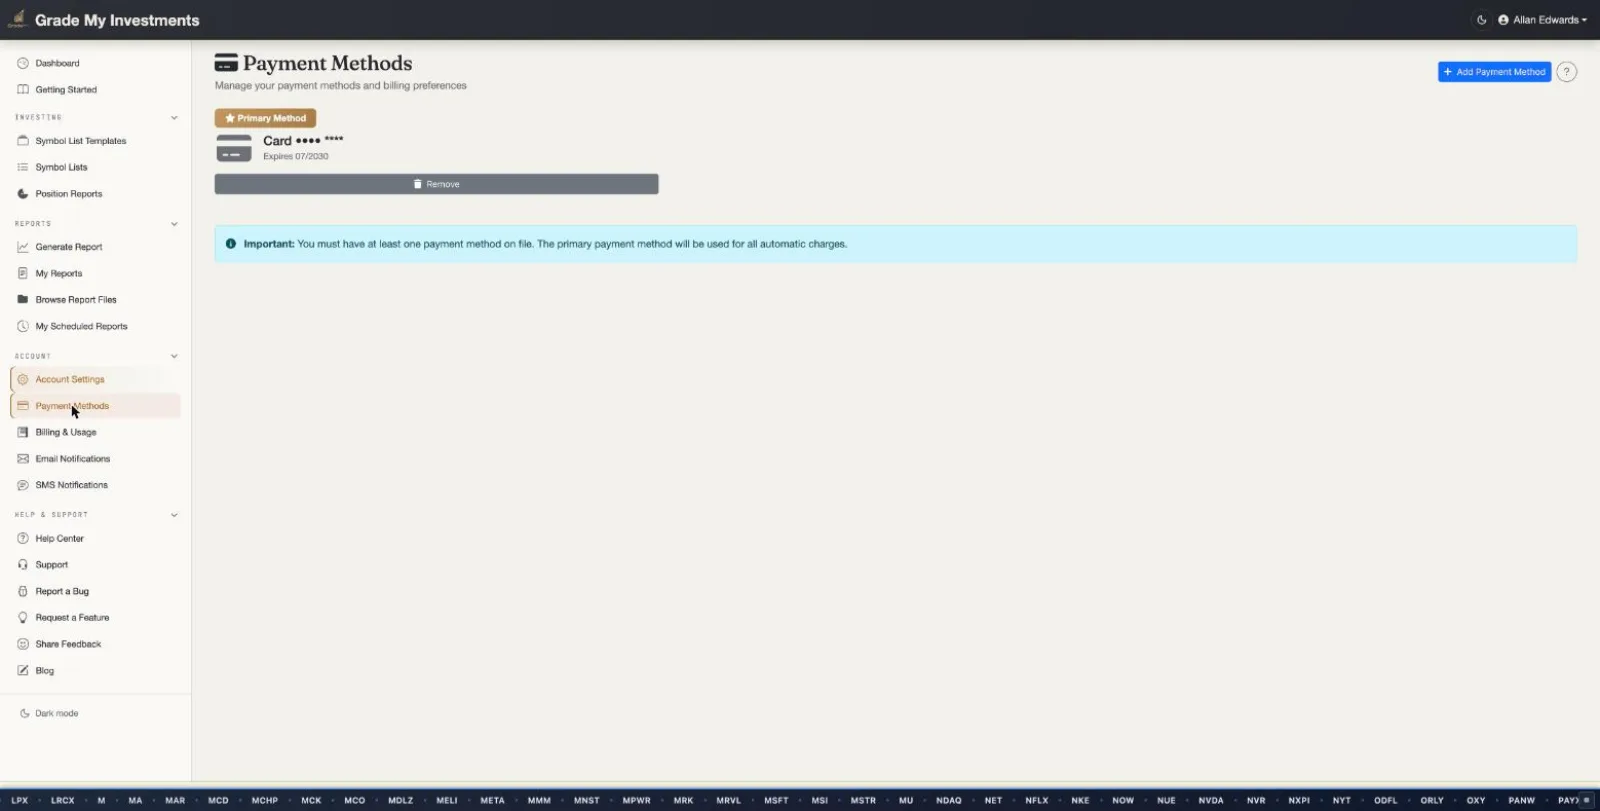
Payment Method Management
Manage payment methods for your account:
- Card Management: Add, update, and remove credit/debit cards via Stripe Elements integration
- Default Card: Set your default payment method for billing
- Secure Storage: PCI-compliant tokenized card storage via Stripe
- Expiration Monitoring: Proactive banner warnings when cards are expiring soon with auto-redirect when all cards are expired
Billing & Usage
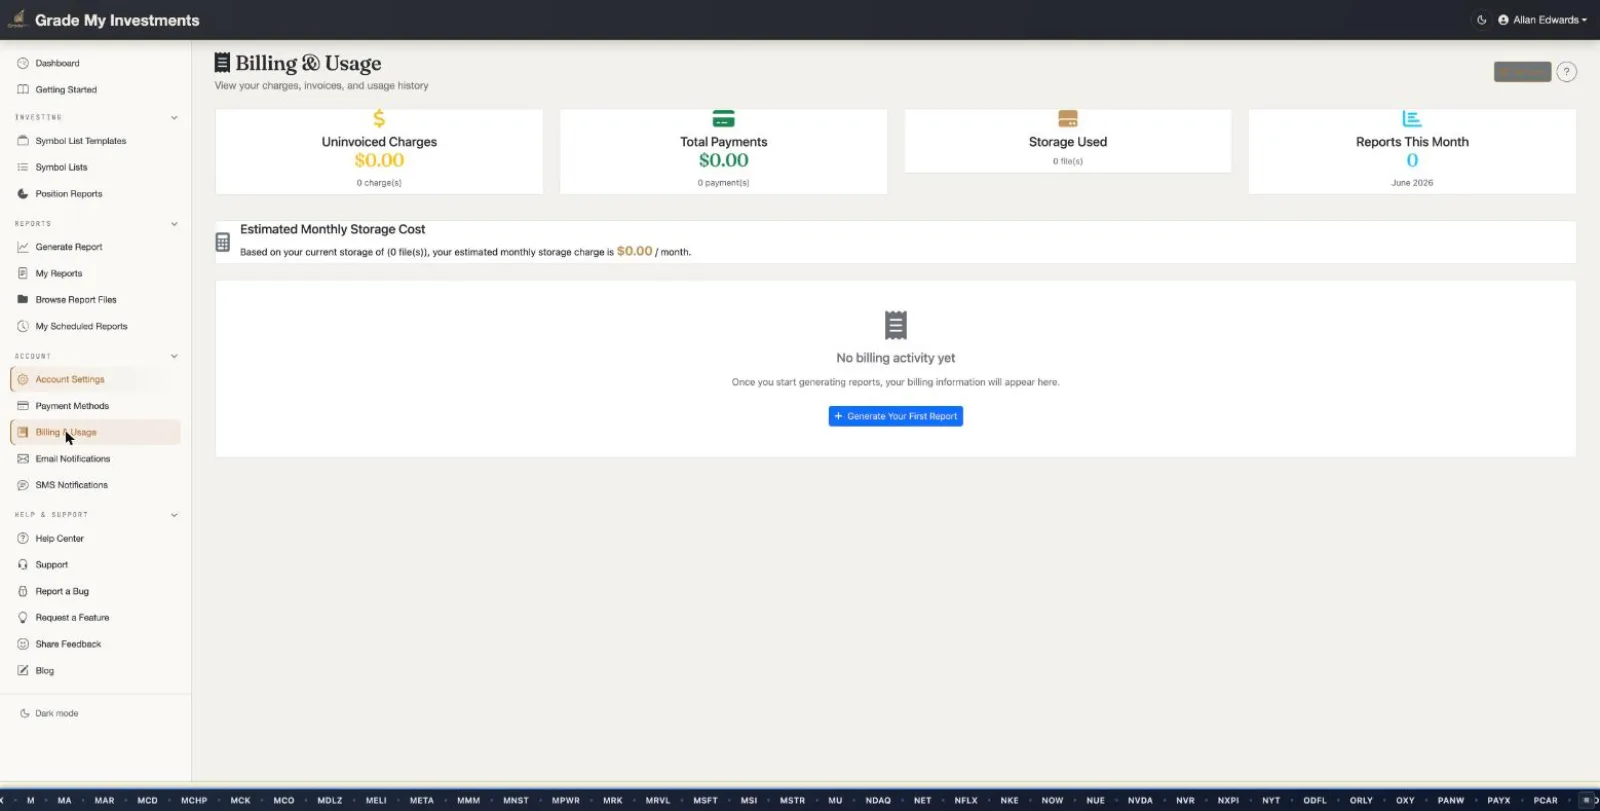
Billing & Usage Dashboard
Comprehensive billing transparency with detailed usage tracking:
- Key Metrics: Uninvoiced charges, total payments, storage used, and reports generated this month displayed in summary cards
- Storage Cost Estimate: Calculated monthly storage cost based on current file usage with per-GB pricing
- Current Charges: Itemized list of uninvoiced charges including Claude AI analysis, report generations, and storage with transaction IDs
- Invoice History: Past invoices with billing period, creation date, amount, and download buttons
- Monthly Usage & Billing: 12-month history showing reports generated, total charges, and invoice status for each month
Blazor WebAssembly
- Client-side WebAssembly rendering
- SignalR real-time connectivity
- Component-based UI
- C# throughout stack
- .NET 10
Page & Component Count
- 70 total pages
- 45 private authenticated pages
- 23 public content pages
- 2 auth/utility pages
- 11 shared components
- 5 JS interop modules
- 3 layout components
Private Page Breakdown
- 2 dashboard/onboarding
- 3 symbol/template pages
- 2 position report pages
- 4 report pages
- 1 file browser page
- 4 notification pages
- 7 account/billing/payment pages
- 2 utility pages (home redirect, error)
Security
- Google OIDC authentication
- Role-based authorization
- HTTPS enforcement
- Content Security Policy (CSP)
- Idle timeout with warning modal
- Account guard route protection
- PCI-compliant Stripe tokenization
Design System
- Bootstrap 5.3
- Font Awesome 6.4 Icons
- Syncfusion Blazor Components
- Shepherd.js Guided Tours
- Custom Grade My Investments branding
- Mobile-first responsive design
- Gold/bronze accent theme
Third-Party Integrations
- Stripe Elements (payments)
- Google OIDC (authentication)
- Syncfusion Blazor (UI components)
- Claude AI (file analysis & comparison)
- Twilio (SMS verification)
- FMP (financial data & symbol validation)
Responsive Design
- Desktop optimized
- Tablet friendly
- Mobile accessible
- Flexible grid layouts
Performance
- WebAssembly client-side execution
- Component caching
- Lazy loading
- Background polling (15s intervals)
- Bundle optimization