
Report Output Organization
Understanding how Grade My Investments generates, organizes, and delivers comprehensive financial reports.
flowchart TB
    JOB[Job Root<br/>Job-64-20260326-160457]:::app
    GC[globstats-combined<br/>xlsx - html]:::data
    GT[globstats-target<br/>xlsx - html]:::data
    ML[ml-forecasts<br/>xlsx - html]:::data
    LIST[Symbol List Folder<br/>e.g. Mag 7]:::svc
    GL[globstats-Mag 7<br/>xlsx - html]:::data
    RPT[Reports subfolder<br/>batched 1-7]:::svc
    RAW[Raw Data subfolder<br/>batched 1-7]:::svc
    SYM[symbol-report-SYMBOL<br/>xlsx - html per stock]:::app
    JSON[SYMBOL-raw-data<br/>json per stock]:::ext
    NOTIFY[Notification<br/>Email - SMS - In-App]:::sec
    JOB --> GC
    JOB --> GT
    JOB --> ML
    JOB --> LIST
    LIST --> GL
    LIST --> RPT
    LIST --> RAW
    RPT --> SYM
    RAW --> JSON
    JOB --> NOTIFY
classDef app fill:#1f2630,stroke:#C0894E,color:#F3EFE8;
classDef svc fill:#241c14,stroke:#E2B583,color:#F3EFE8;
classDef data fill:#22201a,stroke:#C0894E,color:#EBD3AE;
classDef ext fill:#1b1f27,stroke:#5A616B,color:#C4C0B8;
classDef sec fill:#1d2733,stroke:#5cc8e0,color:#eafaff;
Report Generation Pipeline
Generation Workflow
- Job Initiation: User submits symbol list for analysis
- Data Collection: Market data fetched from multiple sources
- Analysis Engine: Multi-threaded processing of financial metrics
- Report Generation: Excel, HTML, and JSON formats created
- Storage & Delivery: Files stored in Azure Blob, notifications sent
HTML ↔ Dashboard Parity
HTML reports now match the web dashboard one-for-one — same charts, same metrics, same forward projections — so a customer who downloads the HTML and a customer who logs into the dashboard see exactly the same view. Per-symbol Excel workbooks include 4 dedicated forward-projection sheets driven by the shared ProjectionCalculator, alongside the historical analysis tabs.
Report File Structure
Excel Report Organization
| Worksheet | Content | Purpose |
|---|---|---|
Summary |
Portfolio overview and key metrics | Quick snapshot of all holdings |
Detail Analysis |
In-depth metrics for each symbol | Comprehensive technical indicators |
Performance |
Historical performance data | Track gains/losses over time |
Risk Analysis |
Volatility and risk metrics | Portfolio risk assessment |
Charts |
Visual representations | Graphical analysis of trends |
File Naming Convention
symbol-report-{SYMBOL}.xlsx / .html
Per-symbol report. Example: symbol-report-AAPL.xlsx, symbol-report-AAPL.html
globstats-combined.xlsx / .html
Combined global statistics across all symbols
globstats-target.xlsx / .html
Target-focused global statistics
globstats-{ListName}.xlsx / .html
Per-list global statistics. Example: globstats-Mag 7.xlsx
ml-forecasts.xlsx / .html
Machine learning forecast data
{SYMBOL}_raw_data.json
Raw data export per symbol. Example: AAPL_raw_data.jsonSupported Output Formats
Excel (.xlsx)
Full interactive reports with formulasHTML (.html)
Browser-viewable formatted reportsJSON
Machine-readable data exportGrade My Investments Report Layout
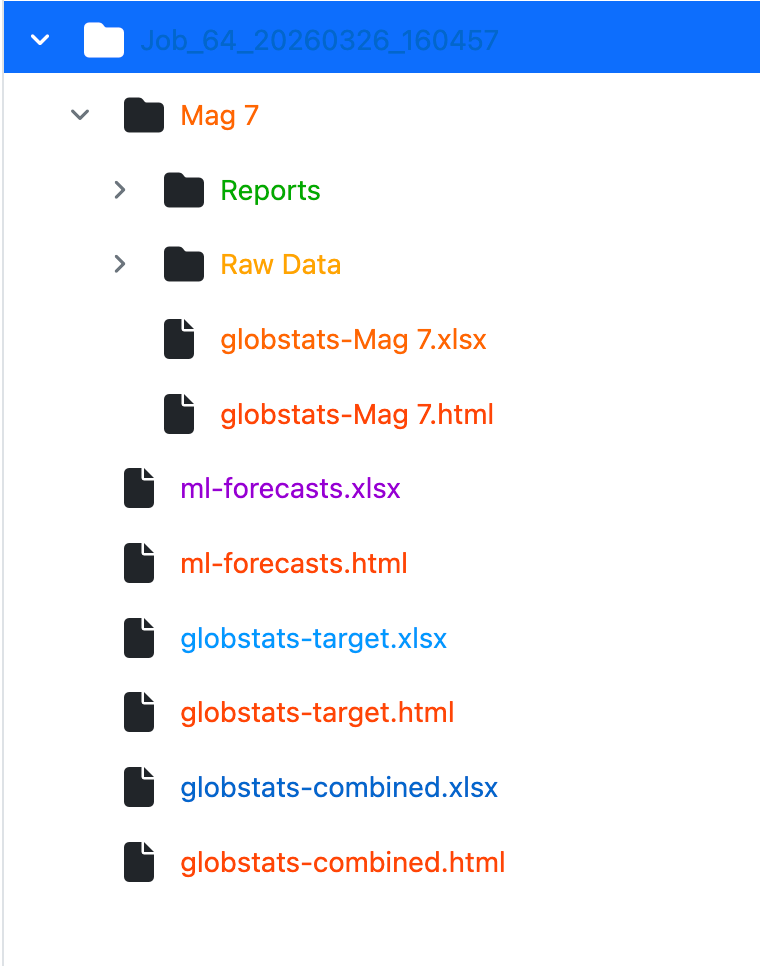
The following screenshot shows the on-disk report output structure from Job 64, demonstrating how Grade My Investments organizes generated files:
Report Layout Analysis
This comprehensive report layout demonstrates Grade My Investments' sophisticated financial analysis capabilities:
Data Structure
- Symbol Column: Stock ticker symbols (AAPL, MSFT, GOOGL, etc.)
- Current Price: Real-time market pricing data
- Market Cap: Company valuation metrics
- Volume: Trading activity indicators
- 52-Week Range: Annual high/low price points
Financial Metrics
- P/E Ratios: Valuation analysis and comparison
- Dividend Yield: Income generation potential
- Performance Ratios: YTD, 1-year, 5-year returns
- Beta Values: Market volatility correlation
- Technical Indicators: RSI, moving averages, momentum
Visual Organization Features
- Color-Coded Headers: Blue headers for easy navigation and section identification
- Alternating Row Colors: Light/dark alternating rows for improved readability
- Data Formatting: Currency, percentage, and number formatting for clarity
- Conditional Formatting: Visual indicators for gains/losses and performance
- Frozen Panes: Header rows remain visible during scrolling
Professional Analysis Features
- Comprehensive Coverage: Multiple stocks analyzed simultaneously for portfolio optimization
- Real-Time Data: Current market prices and up-to-date financial metrics
- Risk Assessment: Beta and volatility metrics for informed decision-making
- Performance Tracking: Historical performance data across multiple time periods
- Export Ready: Professional formatting suitable for client presentations and investment committees
Real-Time Data
Live market prices and current financial metricsMulti-Symbol Analysis
Comprehensive portfolio-wide financial analysisExcel Integration
Full Excel functionality with formulas and formattingDownloaded Report Files from Client Web
Local Machine Download Example
When users download reports from either the Grade My Investments Client Web application or Admin Web application, files are packaged as ZIP archives and extracted to the user's local machine. The file tree below demonstrates the actual file structure and naming conventions as they appear on the user's computer after download and extraction from either web interface.
Job 64 Report Output File Tree
Job_64_20260326_160457/
├── globstats-combined.xlsx
├── globstats-combined.html
├── globstats-target.xlsx
├── globstats-target.html
├── ml-forecasts.xlsx
├── ml-forecasts.html
└── Mag 7/
    ├── globstats-Mag 7.xlsx
    ├── globstats-Mag 7.html
    ├── Reports/1 - 7/
    │   ├── symbol-report-AAPL.xlsx
    │   ├── symbol-report-AAPL.html
    │   ├── symbol-report-AMZN.xlsx
    │   ├── symbol-report-AMZN.html
    │   ├── symbol-report-GOOGL.xlsx
    │   ├── symbol-report-GOOGL.html
    │   ├── symbol-report-META.xlsx
    │   ├── symbol-report-META.html
    │   ├── symbol-report-MSFT.xlsx
    │   ├── symbol-report-MSFT.html
    │   ├── symbol-report-NVDA.xlsx
    │   ├── symbol-report-NVDA.html
    │   ├── symbol-report-TSLA.xlsx
    │   └── symbol-report-TSLA.html
    └── Raw Data/1 - 7/
        ├── AAPL_raw_data.json
        ├── AMZN_raw_data.json
        ├── GOOGL_raw_data.json
        ├── META_raw_data.json
        ├── MSFT_raw_data.json
        ├── NVDA_raw_data.json
        └── TSLA_raw_data.json
Download Process
- ZIP Packaging: Multiple report formats bundled together
- Client & Admin Access: Download from My Reports (Client) or cross-account management (Admin)
- Local Extraction: Files extracted to user's Downloads folder
- File Organization: Maintains original naming structure
- Multiple Formats: Excel, HTML, and JSON versions included
File Structure Analysis
- Job Root Folder: Job_64_20260326_160457 (Job ID + timestamp)
- Symbol List Folders: Organized by symbol list name (e.g., Mag 7)
- Reports Subfolder: Per-symbol Excel and HTML reports
- Raw Data Subfolder: JSON data exports per symbol
- Global Stats: Combined and per-list aggregated statistics at root and list level
Downloaded File Types Breakdown
Excel Report (.xlsx)
- - Interactive spreadsheet format
- - Multiple worksheets with data
- - Formulas and conditional formatting
- - Charts and visualizations
- - Professional business format
HTML Report (.html)
- - Browser-viewable format
- - No software installation needed
- - Formatted tables and styling
- - Quick preview and sharing
- - Mirrors Excel report content
JSON Data (.json)
- - Machine-readable data format
- - API and integration friendly
- - Custom analysis and processing
- - Structured data export
- - Developer and analyst use
User Experience Benefits
- One-Click Download: Simple download process from Client Web or Admin Web
- Multiple Formats: Choose the right format for your needs
- Offline Access: Files available without internet connection
- Professional Naming: Easy to organize and find files
- Complete Package: All formats included in single download
- Ready to Use: Files immediately accessible after extraction
Storage Organization
Azure Blob Storage Structure
reports/
├── Job_{JobId}_{Timestamp}/
│   ├── globstats-combined.xlsx
│   ├── globstats-combined.html
│   ├── globstats-target.xlsx
│   ├── globstats-target.html
│   ├── ml-forecasts.xlsx
│   ├── ml-forecasts.html
│   └── {SymbolListName}/
│       ├── globstats-{SymbolListName}.xlsx
│       ├── globstats-{SymbolListName}.html
│       ├── Reports/{Start} - {End}/
│       │   ├── symbol-report-{SYMBOL}.xlsx
│       │   └── symbol-report-{SYMBOL}.html
│       └── Raw Data/{Start} - {End}/
│           └── {SYMBOL}_raw_data.json
Folder Hierarchy Features
- Dynamic folder creation based on job metadata
- Symbol list grouping with per-list global stats
- Reports and Raw Data separation for clean organization
- Soft delete with recovery options
Performance Optimization
Generation Optimizations
- Parallel symbol processing
- Batch data fetching
- Memory-efficient streaming
- Asynchronous file writing
- Report template caching
Delivery Optimizations
- CDN integration for downloads
- Compressed file transfers
- Pre-signed URL generation
- Background upload to blob storage
- Incremental report updates
Quick Facts
- Average Generation Time: 30-60 seconds
- Report Size: 500KB - 5MB typical
- Symbols per Report: 1-500+
- Retention: 90 days standard
Notification System
Report completion notifications via:
- Email with download links
- SMS alerts
- In-app notifications
- Push notifications (mobile)
Report Security
- Encrypted at rest
- SAS token access
- User-scoped permissions
- Audit trail logging
- Time-limited URLs
Customization Options
Users can customize:
- Report templates
- Included metrics
- Time periods
- Chart styles
- Delivery preferences
- File formats