Macro Dashboard Architecture
How a stock-grading platform grew a macro instrument: a second console engine, a storage design that keeps MySQL nearly empty, a scheduler that knows the government's calendar, and a failure philosophy where every degradation is visible and nothing fabricates a number. This page is the engineering story; Anatomy of the Macro Readout is the math.
The Factory and the Lighthouse
The platform already had a heavy background worker: Report Generator Alpha, the report factory — a multi-threaded engine that turns a user's request into a finished report package. The Macro Dashboard's workload is the opposite shape in every dimension, so it got its own process: Report Generator Beta, the lighthouse.
| Alpha — the factory | Beta — the lighthouse | |
|---|---|---|
| Trigger | User requests, queued per account | The government's release calendar + a daily floor |
| Output | Millions of per-user report files | One snapshot, shared by every user |
| Scaling question | Throughput per hour | Freshness per release |
| Failure blast radius | One user's report | Everyone — which drives the degradation design below |
Separate process, separate systemd unit, separate failure domain — but the same VM, the same deploy pipeline stage pattern, and the same shared service libraries. A new product surface cost one new unit file and one pipeline stanza, not a new platform. That is the modular-monolith bet paying rent: isolation where blast radius demands it, shared code everywhere else.
flowchart LR
    subgraph VM[Linux VM - one deploy pipeline]
        subgraph ALPHA[Report Generator Alpha - the factory]
            AQ[User report queue] --> AR[Multi-threaded<br/>report builds]
        end
        subgraph BETA[Report Generator Beta - the lighthouse]
            CAL[Release calendar<br/>+ daily floor] --> RUN[Engine run<br/>13 steps]
        end
    end
    AR --> AOUT[(Per-user report files<br/>millions, per-account)]
    RUN --> BOUT[(One shared snapshot<br/>same for every user)]
    USERS[Users] -->|request reports| AQ
    GOV[Government releases<br/>jobs, CPI, PCE, FOMC] -->|schedule| CAL

    classDef svc fill:#241c14,stroke:#E2B583,color:#F3EFE8;
    classDef data fill:#22201a,stroke:#C0894E,color:#EBD3AE;
    classDef ext fill:#1b1f27,stroke:#5A616B,color:#C4C0B8;
    class AQ,AR,CAL,RUN svc;
    class AOUT,BOUT data;
class USERS,GOV ext;Blob Wholesale, MySQL Sliver
Macro data is a small big-data problem: 38 series × decades of monthly history × full refetch every run. None of it belongs in a relational database, because none of it is ever queried relationally — it's read whole, rendered whole, and replaced whole. So the storage rule is blunt: blob storage holds everything heavy; MySQL holds only what must answer a WHERE clause.
- Blob (wholesale): the dashboard snapshot (with its SSA projections inline), 38 full-history series files, the commodities blob and its projections, daily snapshot archives, the backtest artifact, the sector-returns playbook, the Macro Lab pack, and pinned copies of every shared dashboard. Cheap, versionable, and served to clients through the API with ETag revalidation.
- MySQL (sliver): three small tables — the engine run queue/log, the regime-change event history, and share-link records. Rows, not payloads: the share row stores a token and a blob path, never the snapshot itself.
The economics drove this as much as the aesthetics: managed MySQL is the platform's most expensive storage per gigabyte, and the entire macro feature adds a few kilobytes a day to it. The blob side can grow for years at pennies. When the drill-down UI needs decades of raw observations, the client pulls the series blob straight through the API and renders it — the database never sees the request.
flowchart LR
    ENG[Beta engine run] --> BLOB
    ENG --> SQL
    subgraph BLOB[Azure Blob - the wholesale side]
        SNAP[macro_dashboard.json<br/>atomic swap publish]
        SER[38 series blobs<br/>full history each]
        ARC[Daily archives +<br/>backtest artifact]
        PLAY[Playbook + Lab pack +<br/>grade-regime study]
        SHARE[Pinned shared<br/>snapshots by token]
    end
    subgraph SQL[MySQL - the sliver side]
        RUNS[(Run queue + log)]
        EVT[(Regime change events)]
        LINKS[(Share-link rows:<br/>token + blob path)]
    end
    API[Functions API<br/>ETag revalidation] --> SNAP
    API --> SER
    API --> SHARE
    CLIENTS[ClientWeb / AdminWeb / MAUI] --> API

    classDef svc fill:#241c14,stroke:#E2B583,color:#F3EFE8;
    classDef data fill:#22201a,stroke:#C0894E,color:#EBD3AE;
    classDef ext fill:#1b1f27,stroke:#5A616B,color:#C4C0B8;
    class ENG,API svc;
    class SNAP,SER,ARC,PLAY,SHARE,RUNS,EVT,LINKS data;
class CLIENTS ext;A Scheduler That Reads the Government's Calendar
A naive cron would refresh macro data at midnight and be up to 23 hours stale on the days that matter most — release mornings. The Beta daemon instead carries the release calendar in its configuration: jobs report first Fridays at 8:30 ET, CPI mid-month, PCE month-end, FOMC decision afternoons. It sleeps until shortly after each scheduled release, runs, and also keeps a daily floor run so nothing drifts even in quiet weeks. The admin app can queue a manual run; the engine's queue table makes every trigger — scheduled, release, manual, backfill — a first-class, logged event.
The calendar is data, not code — and the engine nags its operators: when fewer than 60 days of FOMC dates remain in the config, every run raises an alert to go add next year's published schedule. The failure mode of a forgotten calendar is a loud reminder, not silent staleness.
flowchart TB
    OPEN[Open + log run] --> FETCH[Fetch all 38 series<br/>full history, revisions absorbed]
    FETCH -->|series fails| STALE[Carry last good copy<br/>marked STALE on dashboard]
    FETCH -->|zero fresh| ABORT[Abort run - previous snapshot<br/>keeps serving + email/SMS alert]
    FETCH --> DERIVE[Derive computed series<br/>real retail, realized vol]
    STALE --> DERIVE
    DERIVE --> CLASSIFY[Classify regime +<br/>score Macro Grade]
    DERIVE --> ML[SSA projections 1/2/6-mo<br/>21 series + 5 commodities]
    ML -->|no converge| NOFC[Series ships with<br/>NO forecast - never invented]
    CLASSIFY --> NARR[Claude narrative + lint]
    NARR -->|fails| CARRY[Carry yesterday's outlook<br/>stamped with its real date]
    CLASSIFY --> PLAY[Sector playbook + lab pack]
    PLAY -->|market data outage| PCARRY[Carry previous playbook<br/>flagged carried-forward]
    NARR --> ASM[Assemble snapshot]
    CARRY --> ASM
    ML --> ASM
    PLAY --> ASM
    PCARRY --> ASM
    ASM --> SWAP[ATOMIC SWAP publish<br/>old or new, never half]
    SWAP --> EVTS[Write regime-change events<br/>+ close run in MySQL]
    WATCH[Dead-man watchdog:<br/>snapshot older than 30h = page] -.-> SWAP

    classDef svc fill:#241c14,stroke:#E2B583,color:#F3EFE8;
    classDef warn fill:#2a1d1d,stroke:#c96a5a,color:#F3EFE8;
    classDef data fill:#22201a,stroke:#C0894E,color:#EBD3AE;
    class OPEN,FETCH,DERIVE,CLASSIFY,ML,NARR,PLAY,ASM,SWAP,EVTS svc;
class STALE,ABORT,NOFC,CARRY,PCARRY,WATCH warn;Degrade Loudly, Never Fabricate
Because one snapshot serves everyone, the failure philosophy is explicit and mechanical. Every fallback is visible in the product, none invents data:
- A series fails to fetch → the last good copy is used and the dashboard shows a "stale" badge with the as-of date on that series. The run counts fresh vs stale and logs both.
- The AI narrative fails → yesterday's outlook is carried forward, stamped with its original generation date. Arithmetic never waits on prose.
- The sector playbook can't compute (market-data outage) → the previous playbook carries forward wearing a "carried forward" badge.
- The ML forecast can't converge for a series → that series ships with no forecast rather than a made-up one.
- Everything fails → the previous snapshot keeps serving untouched, and the engine alerts by email and SMS on the spot.
The snapshot publish itself is an atomic swap — the new JSON is written to a temp blob and swapped into place, so a reader either sees the old complete snapshot or the new complete snapshot, never a half-written one. Clients revalidate with ETags, so the swap is also the cache invalidation.
Above all of it sits a dead-man watchdog: an independent monitor that alerts when the snapshot's last-modified age exceeds 30 hours. Every failure mode inside the engine can page us; the watchdog exists for the failure modes we didn't imagine — including the engine simply not running.
The Macro Lab — "Same Arithmetic" as a Literal Claim
The Macro Lab lets a user drag the growth-axis weights and watch the entire 29-year regime timeline rebuild instantly. The interesting engineering is in what the browser doesn't do: it never re-implements the classifier. Each engine run precomputes a lab pack — for every month, each gauge's volatility-normalized 3-month impulse, plus the inflation axis direction — and the blend step lives in one shared function in the shared DTO library. The engine calls it to produce the official regime column; the browser calls the identical compiled code (Blazor WebAssembly running the same assembly) for the user's custom weights.
So when the page says the sandbox "runs the same arithmetic as the engine," that's not marketing paraphrase — it's a statement about a single function with two call sites. Rebuild cost per slider move: three multiplications per month across ~355 months. No server round-trip, no drift risk between implementations, and the official regime stays canonical — custom weights feed nothing downstream.
What the Whole Instrument Costs to Run
The marginal infrastructure for the entire Macro Dashboard — engine, storage, API surface — is close to a rounding error: one more systemd unit on a VM that already existed, a few hundred megabytes of blob storage, three small MySQL tables, and a free government data API. The design work was in the shape, not the spend: putting the right data in the right store, making every degradation visible, and keeping the one shared snapshot trustworthy enough that everything else — playbook, lab, shares, the calibration story — could be built on top of it in days.
Commodities & Hard Assets — the Market's Opinions, Same Pipeline
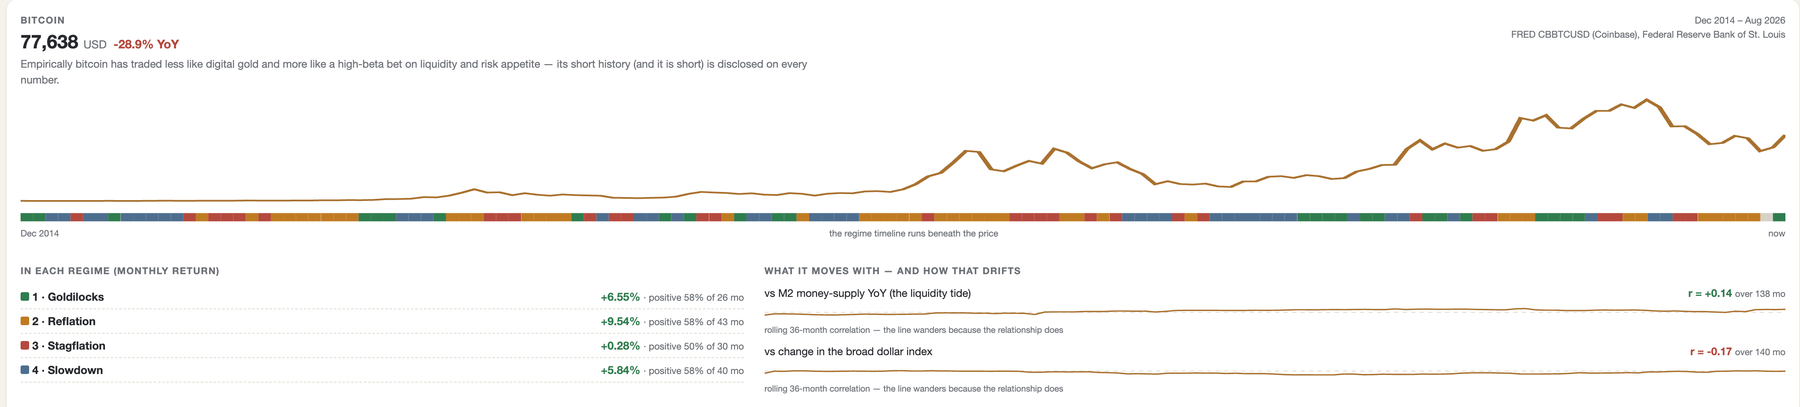
The newest surface reuses every architectural decision above: a CommoditiesService in the
engine run fetches gold/silver (FMP futures) and bitcoin/copper (FRED) alongside the in-run oil and
dollar series, joins monthly returns to the regime ribbon, computes full-window and rolling
36-month Pearson correlations against each asset's classic macro counterpart, and writes one
commodities.json blob — memoized, carry-forward on failure, never able to fail the run.
An engine-written "Market's Mood" paragraph rides the same narrative machinery as the Outlook:
prompt-embedded language rules, prescriptive-language lint, one strict re-prompt, and
carry-forward with the original date stamp. The hard line from the design doc holds in code:
none of these prices ever enter the regime axes or the frozen grade bands.